
Scientific Tool For Site Security & Evaluation
Case Study
Livewire
Desktop
Enterprise
Scientific Research
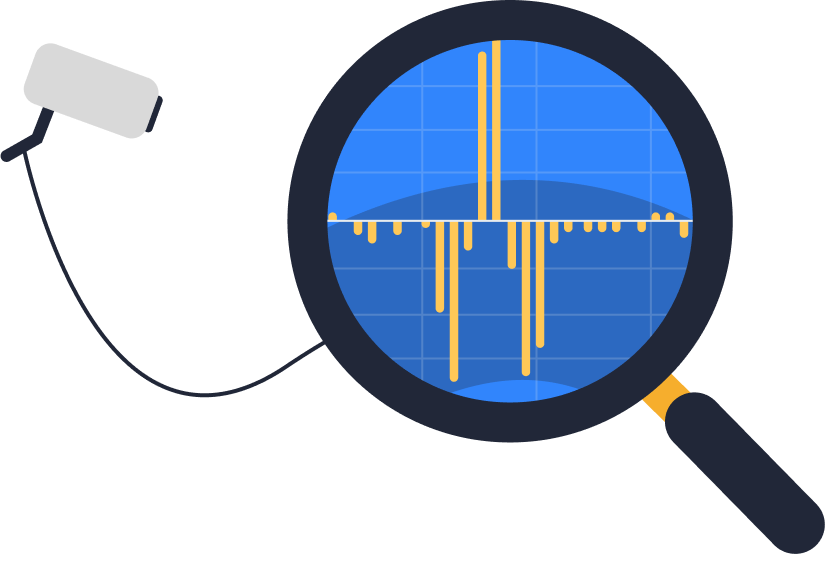
I worked with a research team at a national lab to develop a user interface for use with a time domain reflectometer tool. The application would be used to monitor data from security camera connections to determine if a camera feed is secure.
My Role
Designer
My Responsibilities
UX/UI Design Concepts, User Research, Prototyping, Documentation, Research Paper Contributions
Collaborators
Design Manager, Project Leadership, Engineering
The Problem
No Existing Application
Only researchers who could work with code could process the data. Our challenge was to design an interface that less technical users could understand, and that technical users could use to more efficiently refine their data processing algorithm.
Wide range of uses
Researchers needed to select a period of time to evaluate and a baseline period for comparison. They could evaluate any timeframe from 1 second up to multiple days and the baseline and evaluation periods could also vary dramatically.
Discovery
Who Will Be Using The Tool?
I met with a team of researchers who were currently working with the raw data to define use cases and personas.
Technical users
These users would configure the system for themselves to run evaluations and mark potential tamper events.
Non-technical users
These users can’t configure the system, but can run evaluations against baseline periods and view previous evaluations.
Findings
Further Problem Definition Needed
I met with stakeholders with a list of questions to address the key problems the application needed to solve.
How long are the time periods being evaluated?
Minutes, hours, days, longer?
Is the data constant?
Are there any gaps in the data for the evaluation period?
How long are tamper events typically?
Minutes, hours, days, longer?
What happens if there is a tamper event?
What actions need to take place?
Exploration
Complex Time Controls
The most complex interaction for the app would be interacting with time-based elements with varying degrees of length.
Initial wireframes
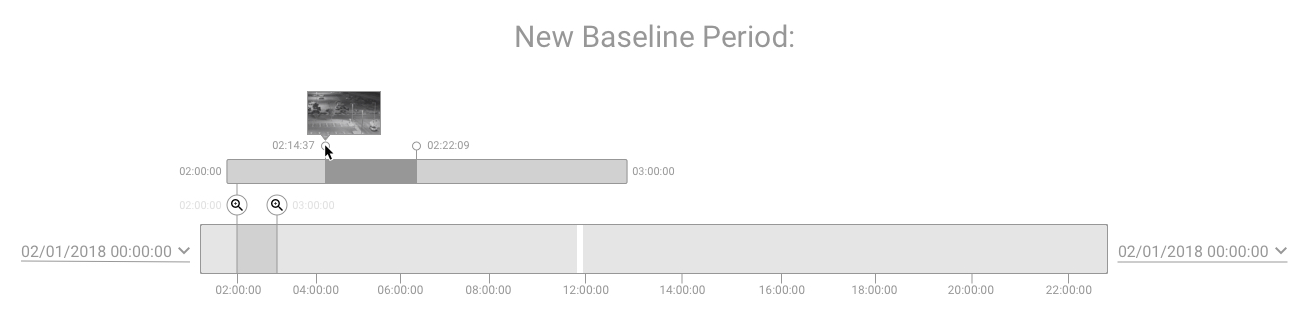
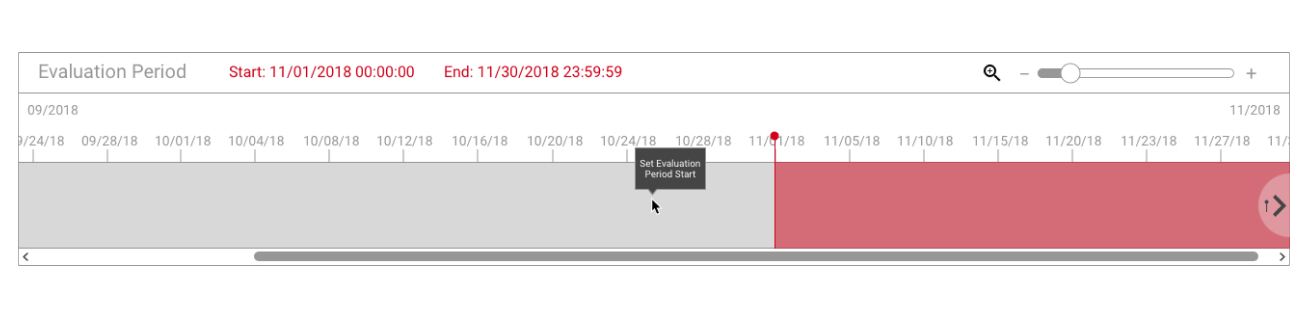
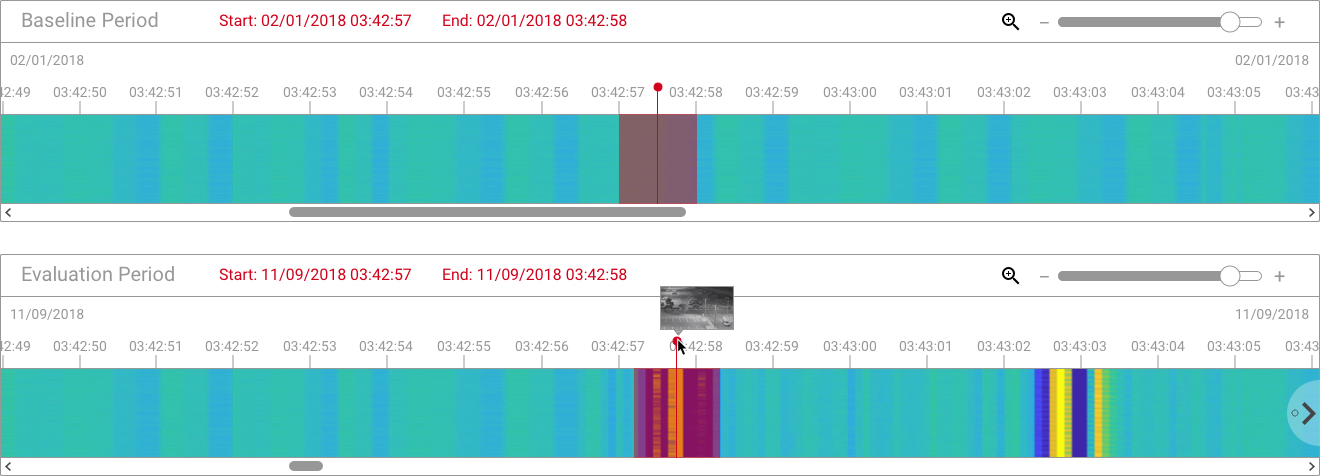
I started by wire-framing a visual timeline control that combined the baseline period, new data, and evaluation period in one view.

Inspiration
Video Editor Timelines
Users needed the ability to view data over a large time period but also zoom in on small increments of time for evaluation. I was inspired by video editing software timeline controls which have the power to adjust the zoom level of the timeline to stretch or condense the content as needed.
Refinement
Viewing Data On The Timeline
After looking at real images of spectrogram data the researchers were generating, it made sense to overlay that data visualization on the timeline to view the data in context.
Final Designs
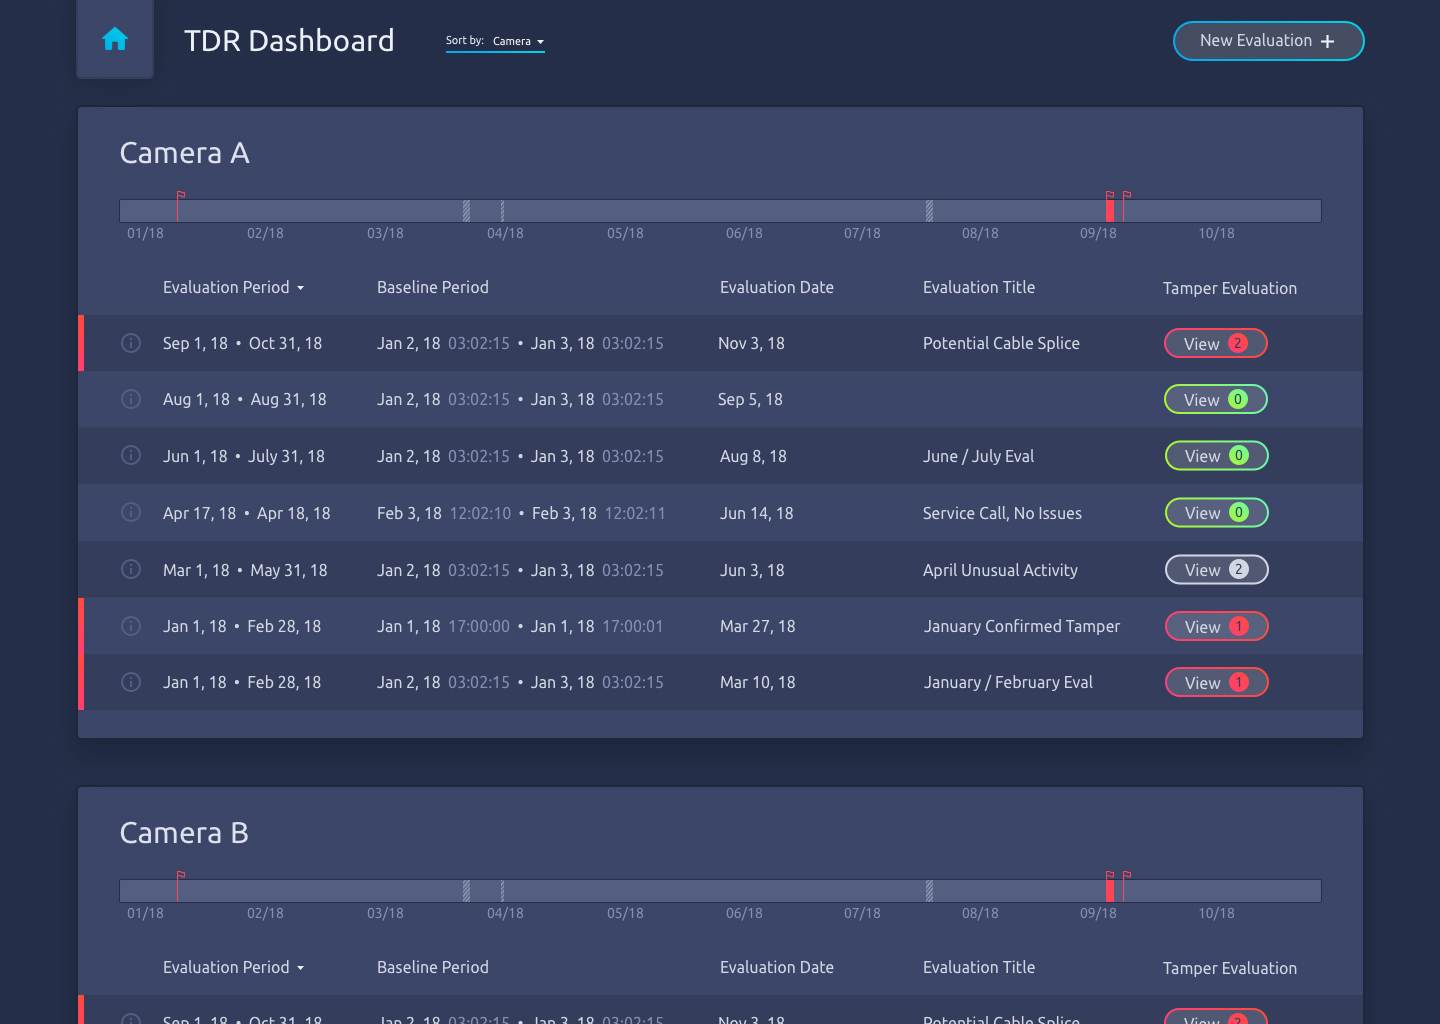
Dashboard
Users can view past evaluations, separated by camera or facility, or run a new evaluation.
Dashboard interactions
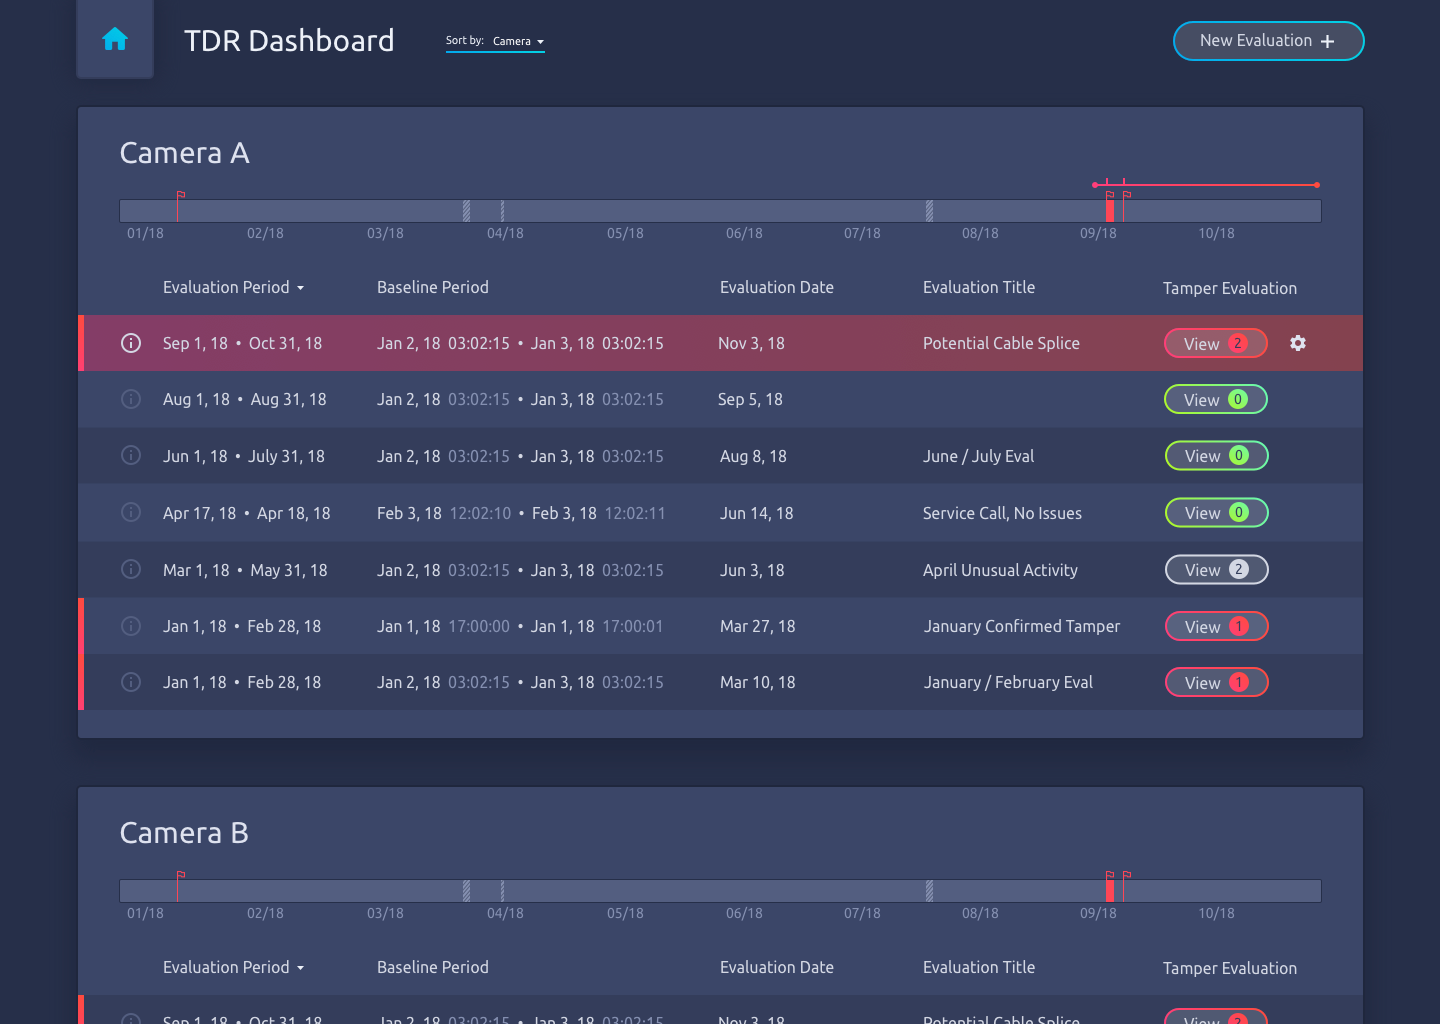
Hovering over an evaluation will highlight the time period that the evaluation took place and any overlap with detected tamper events.
Previous evaluation info
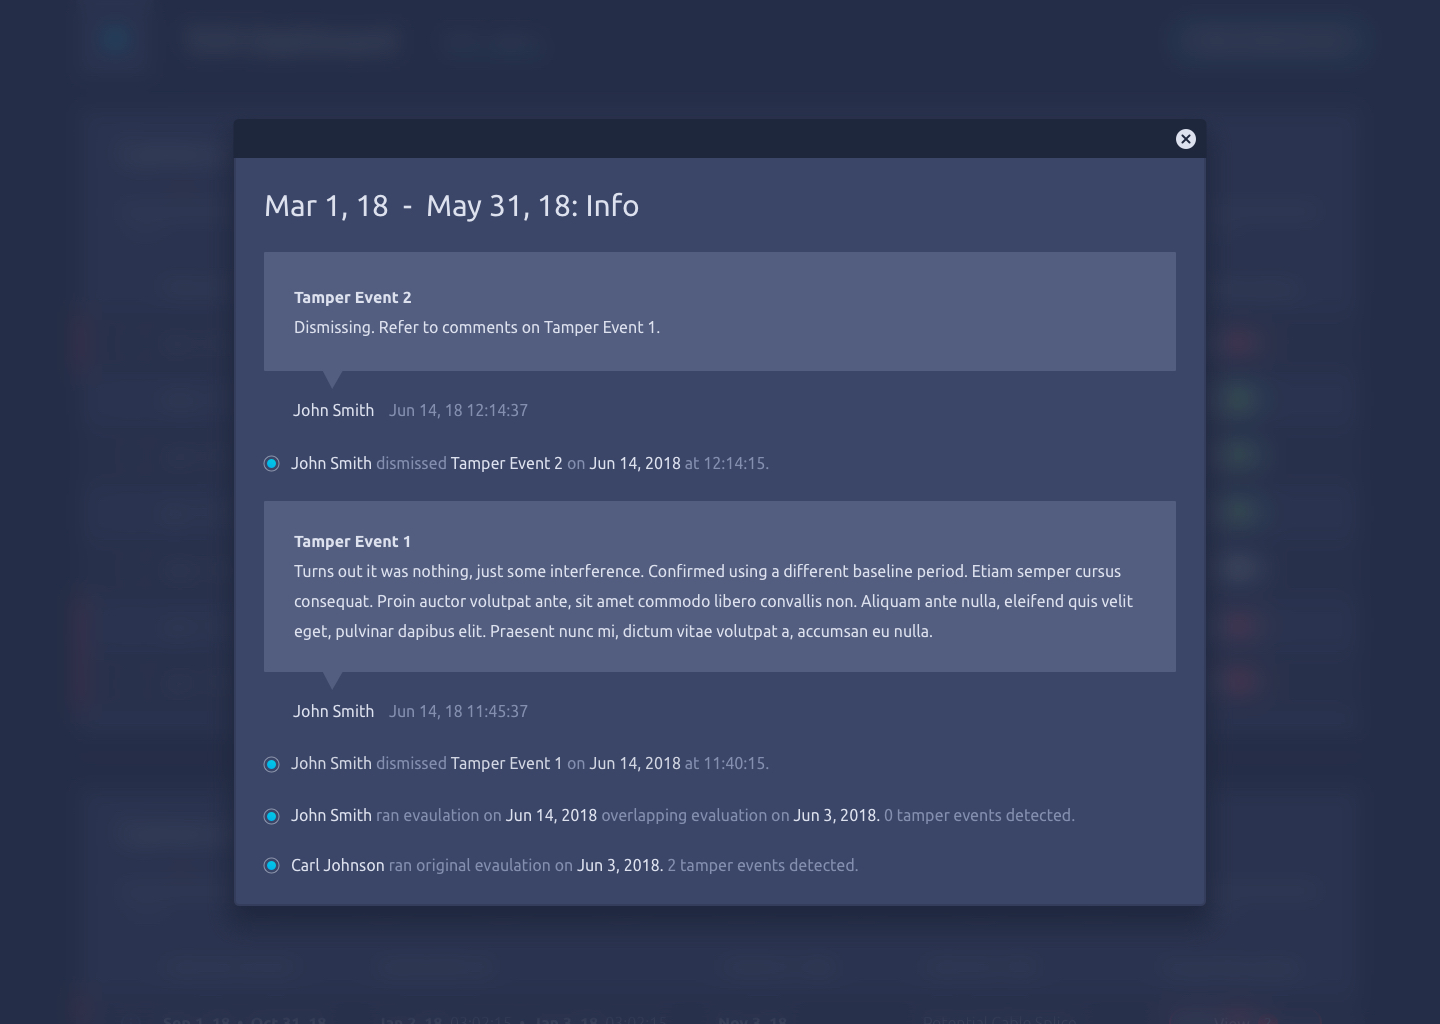
Clicking the information icon on an evaluation lets the user view a history log and related comments.
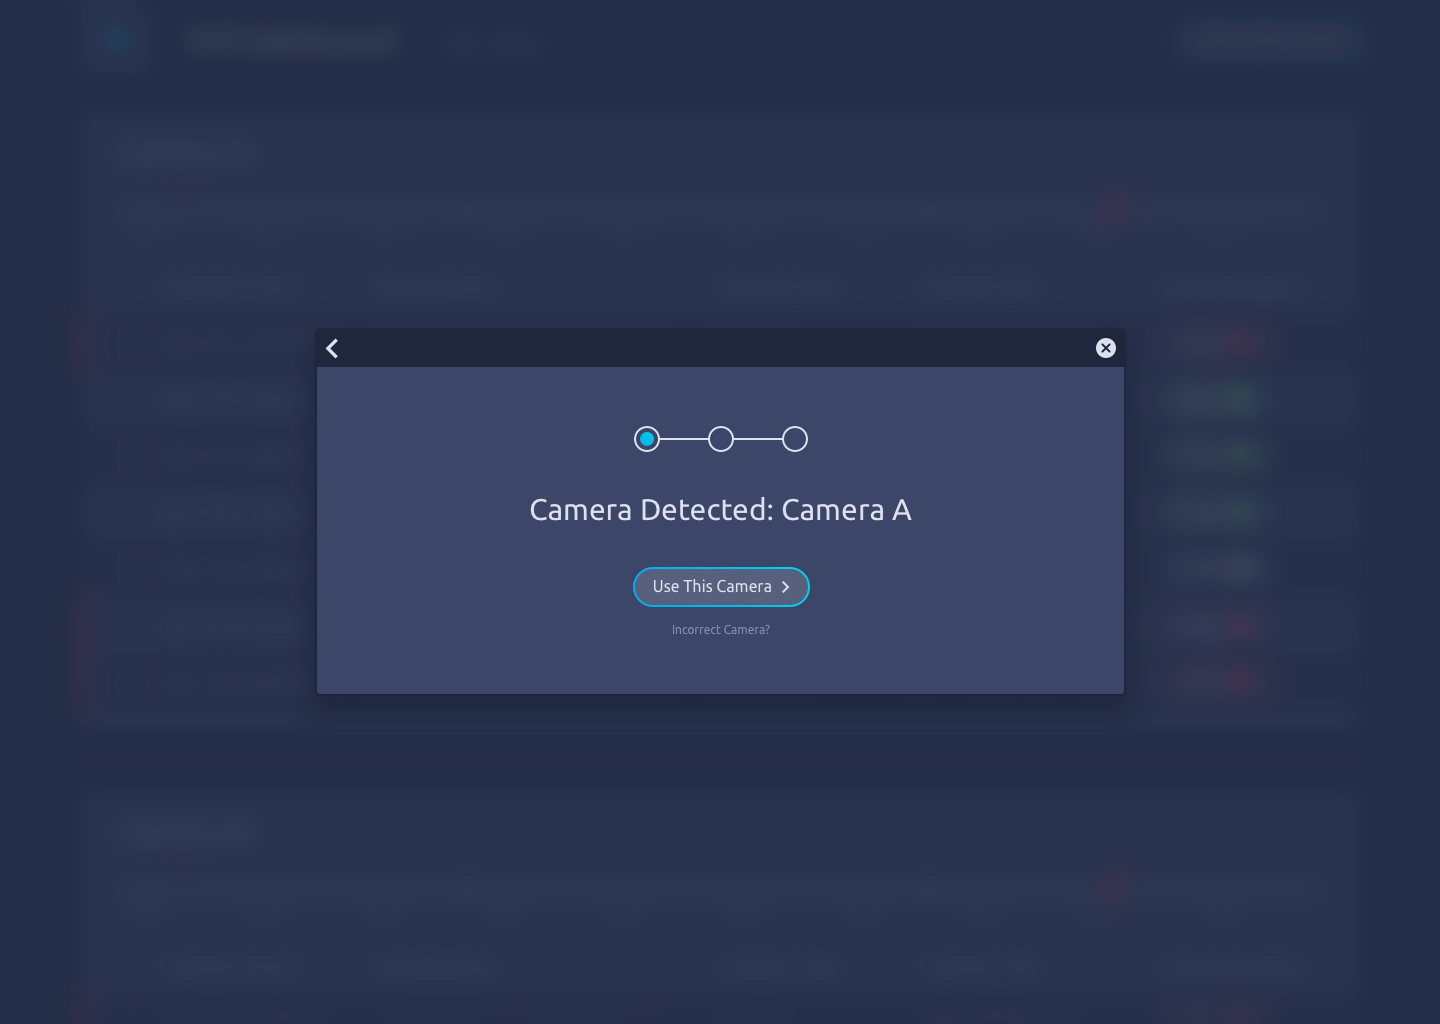
Camera selection
Researchers will import files from their computer into the application. If a previously created camera is detected, the user will be prompted to use this camera.
If the incorrect camera is detected, users can select a camera manually or create a new camera.
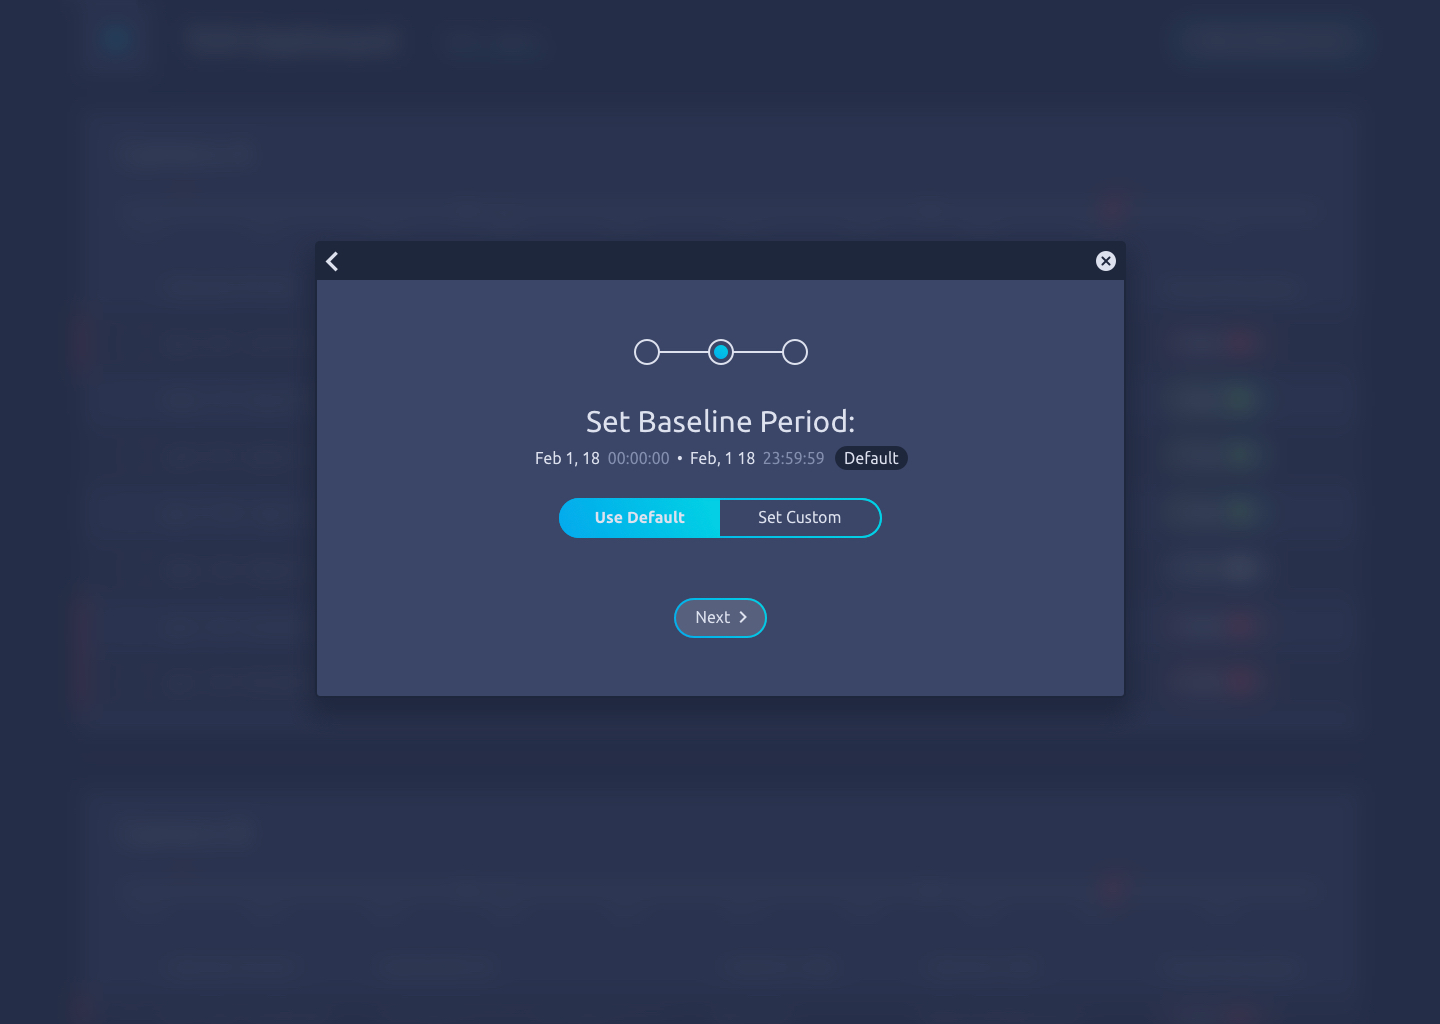
Set baseline period
For a successful evaluation, a clean baseline period must be used for comparison. Most users will accept the default baseline period set by a more technical user.
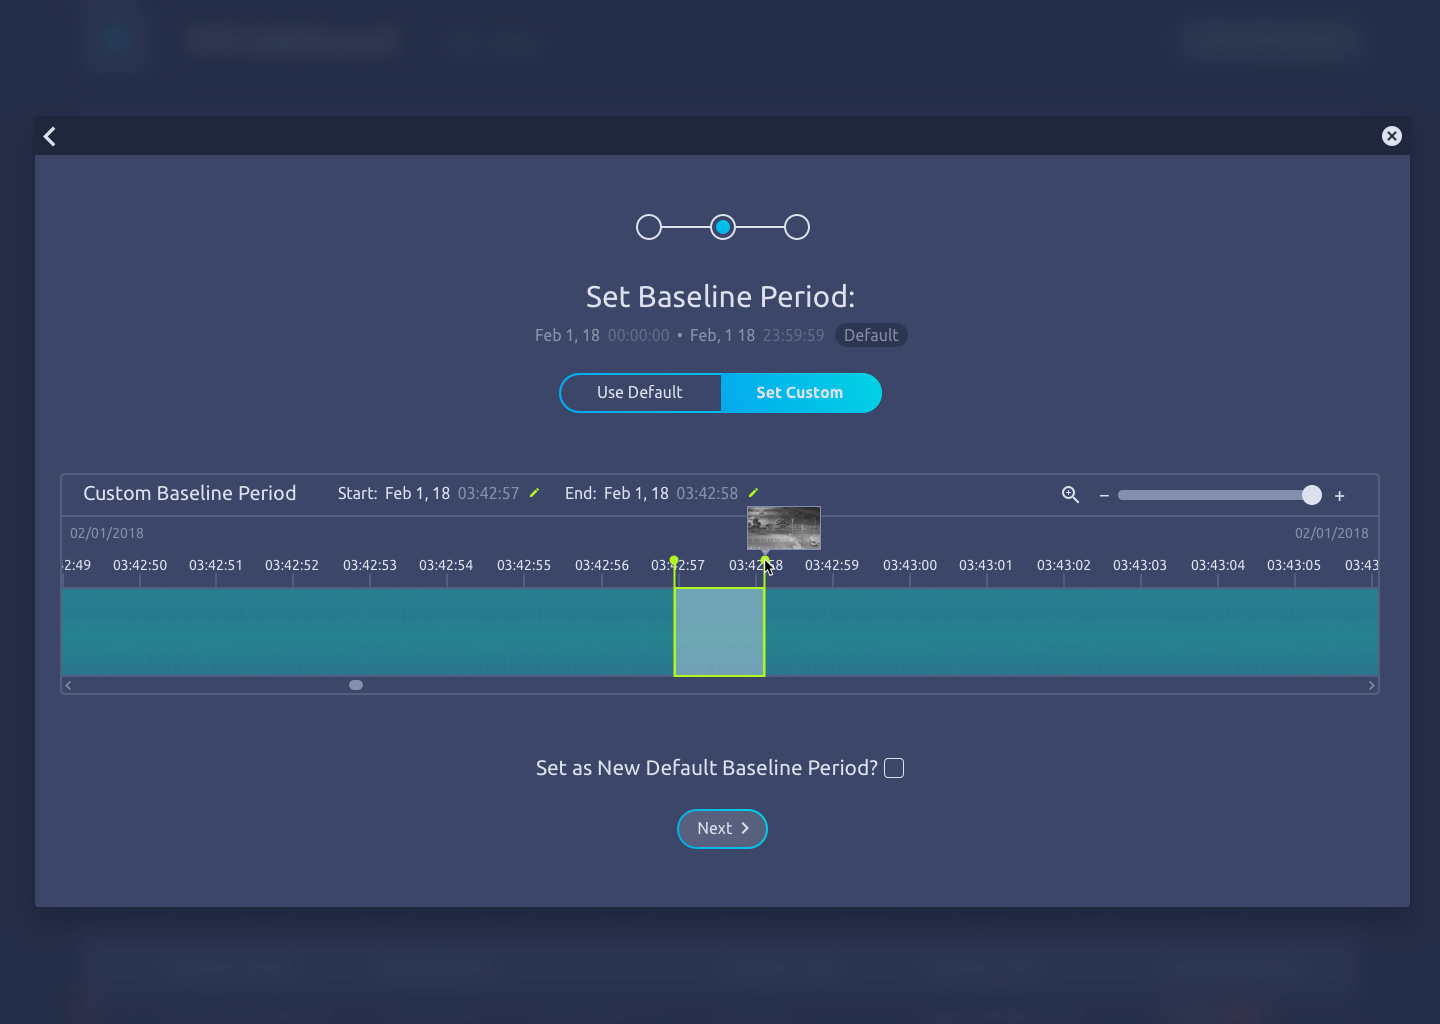
Custom baseline period
When selecting a custom baseline period, users can utilize zoom controls to comb through previously processed data to find a clean baseline period. They can also set this baseline as the default for future evaluations.
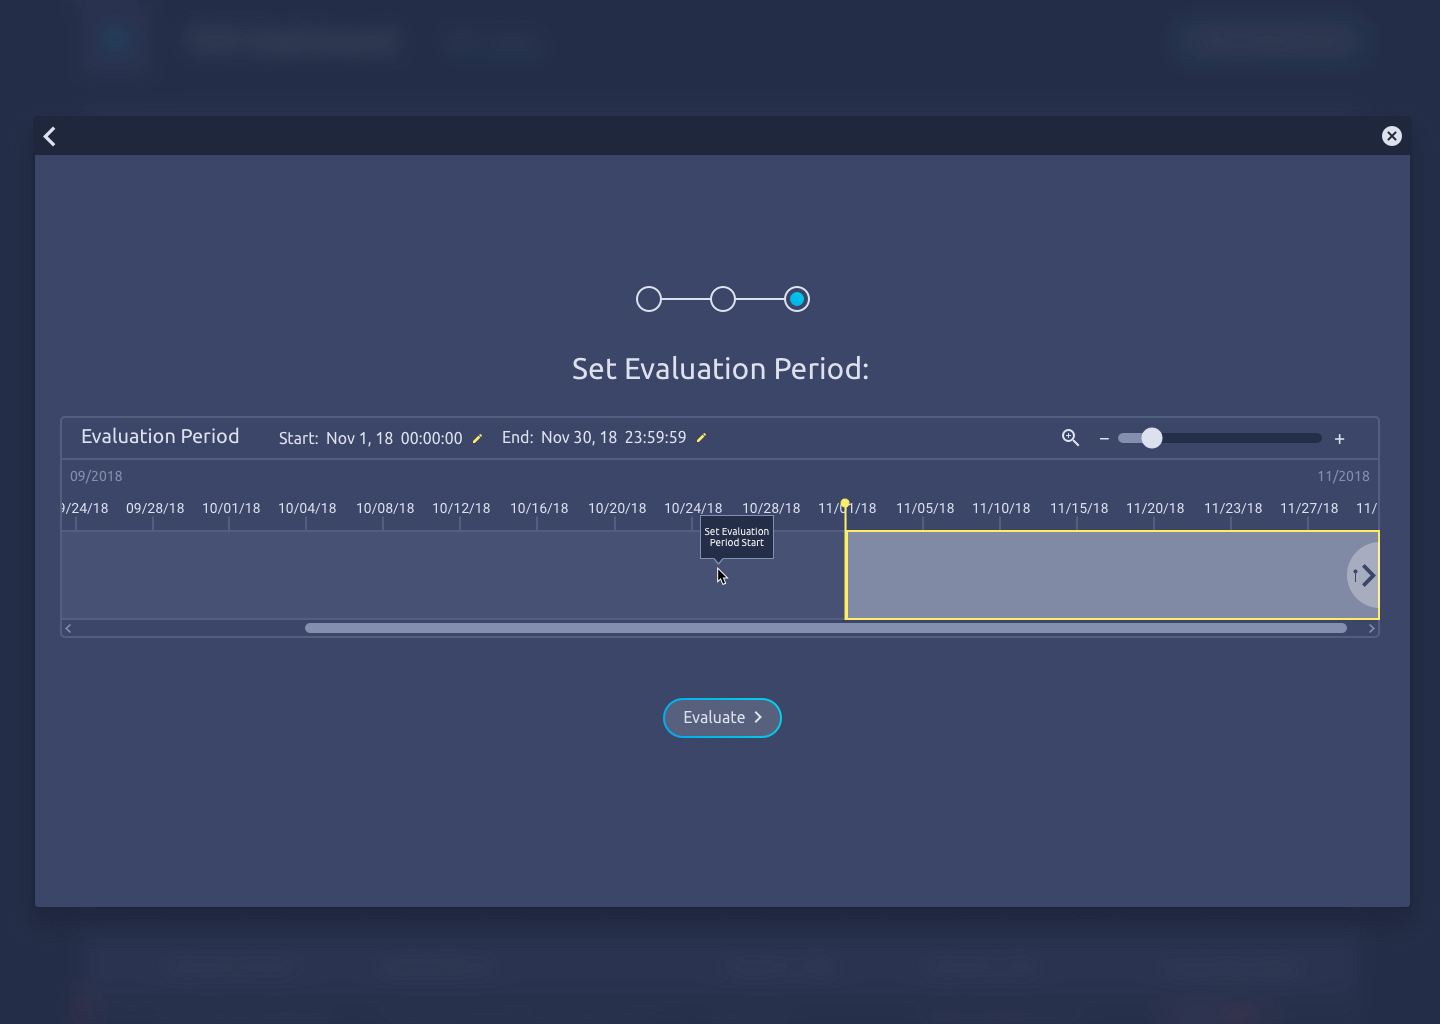
Set evaluation period
All imported data will be selected by default, but users will have the ability to pick a specific evaluation period if they want to look at a smaller data set.
Viewing results
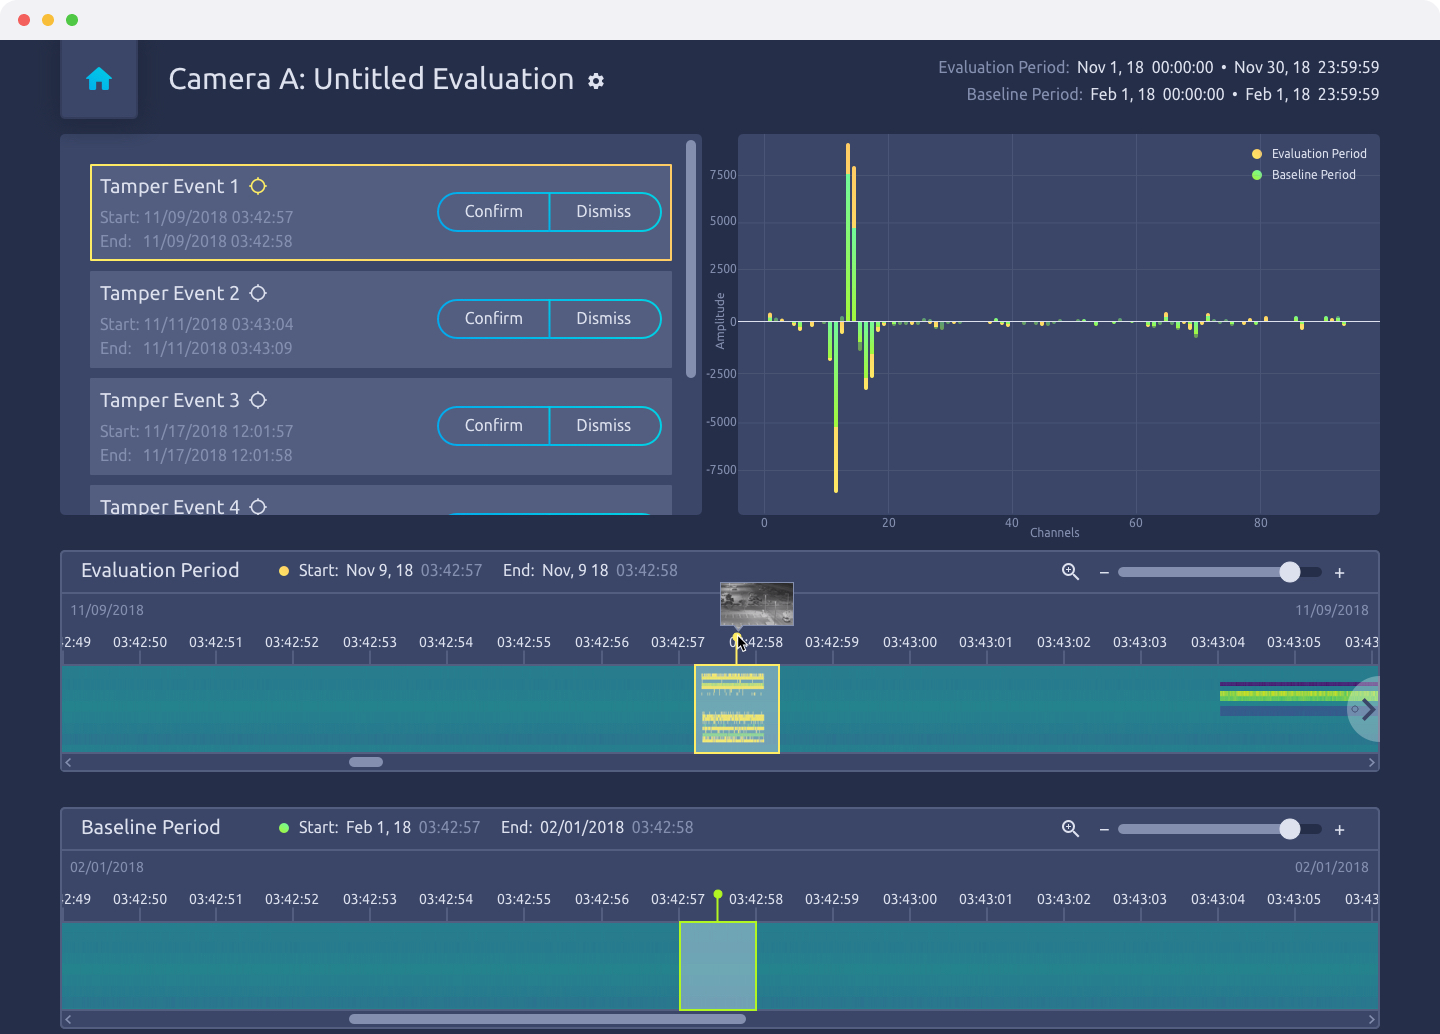
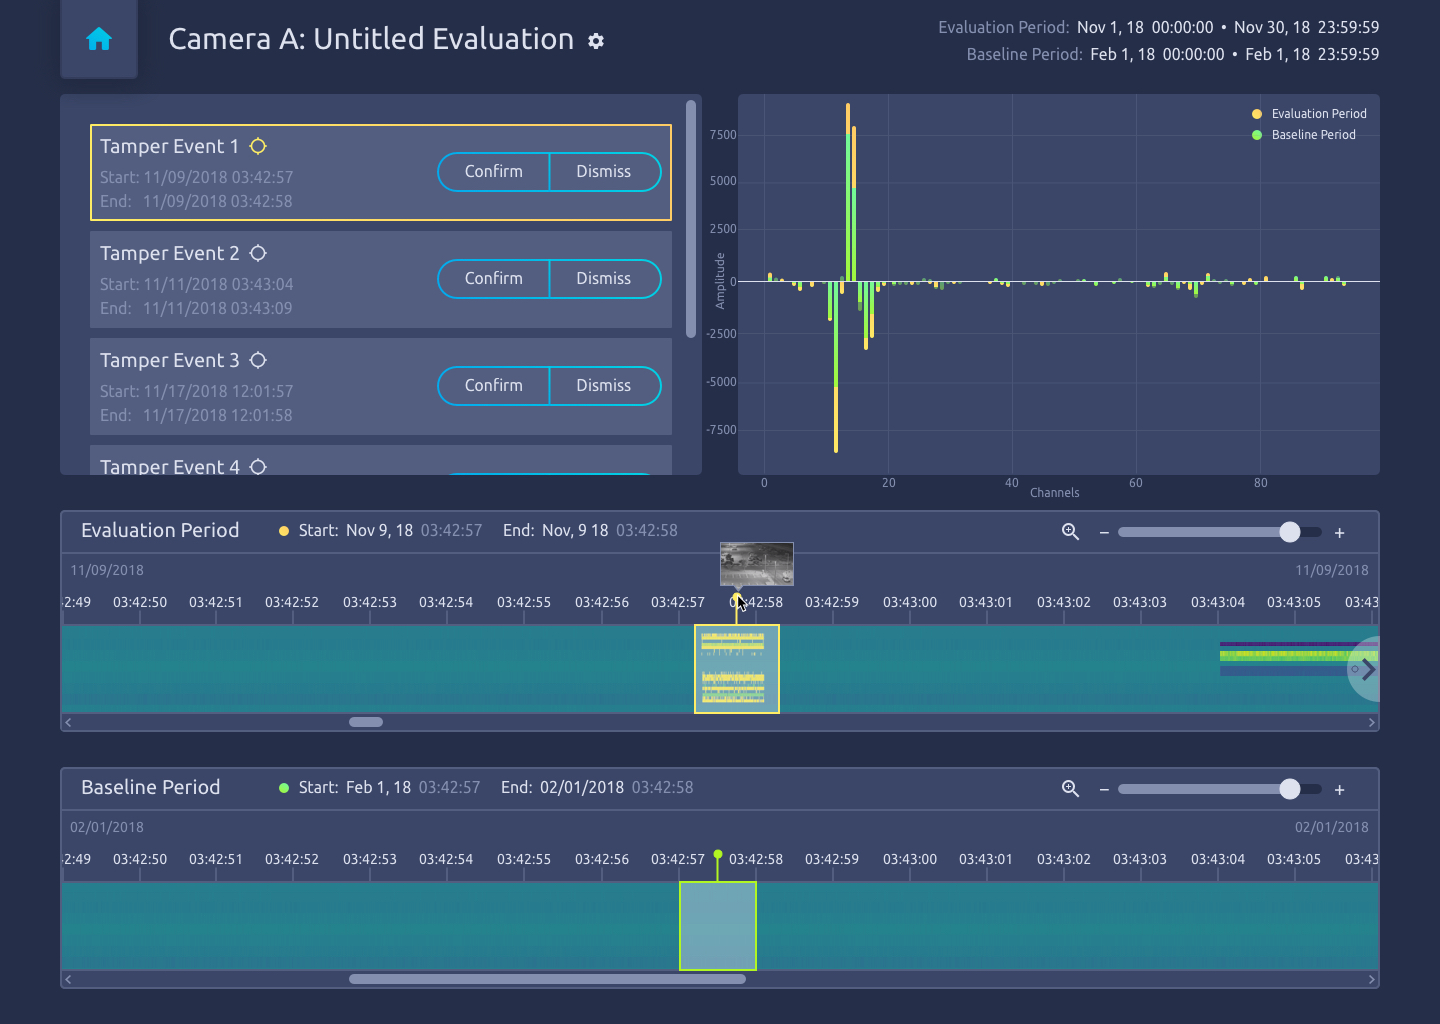
Potential tamper events will be highlighted on the evaluation results screen. The user will be able to zoom in on the timeline to further inspect potential tamper events and then confirm or dismiss them.
When zooming in further on a timeline, spectrogram data will appear that the user can use to compare against the baseline. Selections from the timelines are also overlayed in the graph.
Other Projects

Revolutionizing Apparel Inventory with RFID and AR
Mobile app powered by RFID and AR, enabling associates to quickly locate, count, and stock apparel with precision and ease.
iOS & Android
Enterprise
Augmented Reality
Mobile Ordering for Walmart Managers
Award-winning mobile app that lets managers scan items, get AI-powered recommendations, and place orders while walking the sales floor.
iOS & Android
eCommerce
Let's Connect
Reach out to learn more about my work or to talk design.

